Image pixel prescreen (whole-image QC, no cells needed)¶
Experimental.
Menu: Extensions → SP Classify → Image Pixel Prescreen...
Run this at the start of a project, before segmentation. It reads a low-resolution copy of every image, measures pixel intensities for each channel, and flags images that differ from the rest of the project: mostly background, saturated, weakly stained, or unusually bright or dim. Use it to decide which images to fix, exclude, or label more heavily later. It does not need cells. The Project Prediction Summary does a similar check after classification.
How it works¶
- Each image is read at the pyramid level closest to 2048 px on its long edge, so every image is compared at the same size. Up to 4 images are read at once.
- Channels are matched across images by name.
- Statistics are calculated for each channel (table below), including a sharpness measure (focus).
- The image-level values, and the
p99brightness of each channel that has signal, are converted to robust z-scores across the project:0.6745 × (value − project median) / MAD. This is the same method as §8. - Fixed threshold rules give each image a verdict, zero or more flags, and a written review.
What each statistic means¶
Per channel, over all pixels of the low-resolution image:
| Statistic | What it tells you |
|---|---|
| median | Middle pixel value. Used for sorting and comparison because single bright pixels do not change it. |
| mean | Average pixel value. Single very bright pixels raise it. |
| std | Standard deviation: the spread of pixel values. |
| min / max | Lowest and highest pixel value. max is shown but not used for flags, because one bright pixel sets it. |
| p1 / p99 | 1st and 99th percentiles. p1 is the background level and p99 the signal level. Single extreme pixels do not change them. |
| saturation fraction | Fraction of pixels at or above 99.9% of the highest value the file can store (255 for 8-bit, 65535 for 16-bit). Measures clipping (over-exposure). n/a for floating-point images. |
| Otsu threshold | Automatic cut-off between background and foreground, calculated from the channel histogram. Used by the next two rows. |
| background fraction | Fraction of pixels below the Otsu threshold. |
| foreground coverage | 1 − background fraction: how much of the channel is signal. Low values mean a lot of background. |
| dynamic range | p99 − p1. Close to zero for flat, weak or empty channels. |
| Laplacian variance (focus) | Sharpness measure (higher = sharper). It also depends on brightness, so compare it only within a project. |
Image-level (calculated across channels):
| Statistic | What it tells you |
|---|---|
| empty fraction | Fraction of pixels below the Otsu threshold in every channel. The best measure of how much of the slide is glass or background. |
| focus | The highest per-channel focus value (the sharpest channel). Shown only; it never flags an image, because it changes with brightness as well as sharpness. |
| intensity z | The largest p99 z-score among channels with signal. Sets the INTENSITY_OUTLIER flag. |
Verdicts, flags, and the score¶
Each image gets one verdict and zero or more flags. Default thresholds (z = robust z-score):
| Verdict / flag | Set when |
|---|---|
BACKGROUND_HEAVY |
mean foreground-coverage z ≤ −2.5, or empty-fraction z ≥ 2.5 |
SATURATED |
highest channel saturation fraction ≥ 1% and its z ≥ 3.0, or saturation fraction ≥ 5% whatever the other images show |
WEAK_SIGNAL |
median dynamic-range z ≤ −2.5 |
INTENSITY_OUTLIER |
the p99 z of a channel with signal is ≥ 2.5 or ≤ −2.5 (brighter or dimmer than the project) |
OK |
none of the above |
Only channels with a median foreground coverage of at least 5% across the project are checked for intensity outliers. Channels with almost no signal are skipped, so they cannot produce false flags. Focus is shown but never flags an image.
The Score is the sum of the positive deviations behind the flags. A higher Score means the image is more unusual for the project. The table is sorted by Score by default.
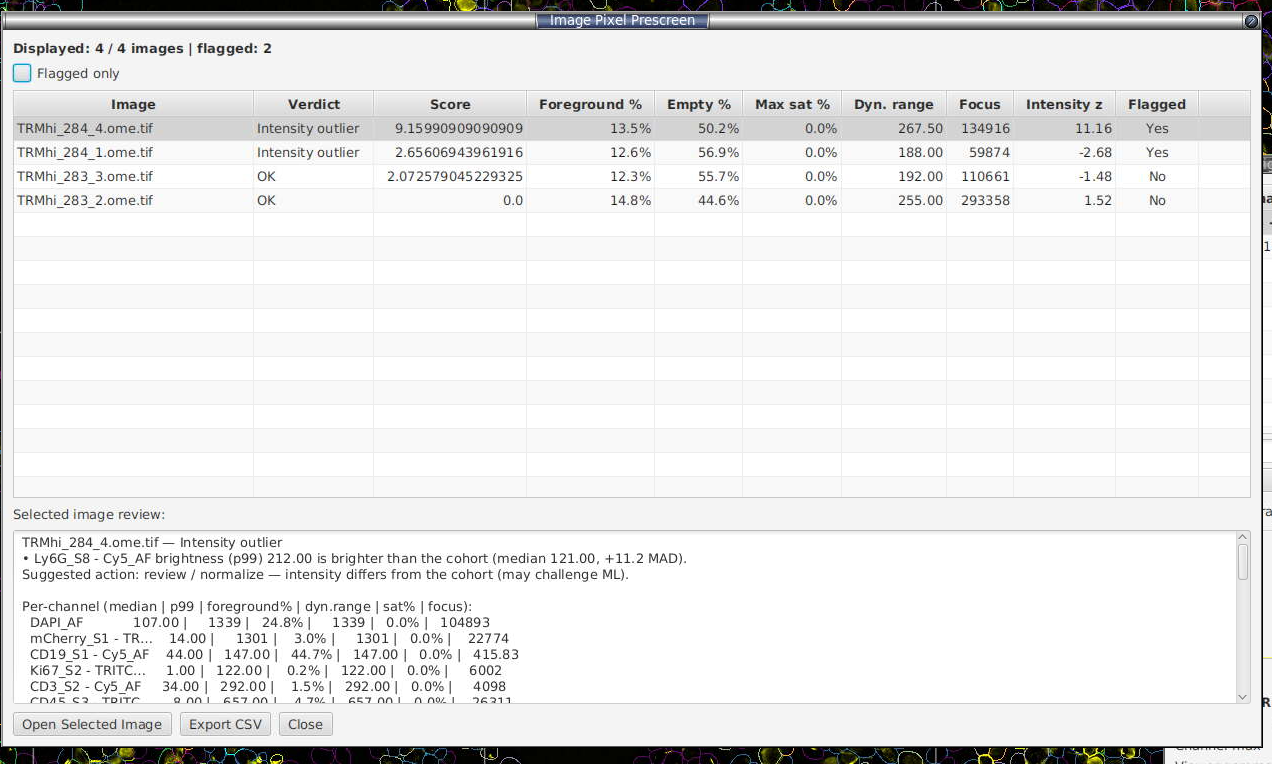
Table columns: Image, Verdict, Score, Foreground %, Empty %, Max sat %, Dyn. range, Focus, Intensity z, Flagged. Tick Flagged only to hide unflagged images.
The review pane below the table explains the result for the selected image, for example:
TRMhi_284_4 — Intensity outlier • Ly6G_S8 - Cy5_AF brightness (p99) 1246.00 is brighter than the cohort (median 220.00, +11.2 MAD). Suggested action: review / normalize — intensity differs from the cohort (may challenge ML).
This is followed by a table for each channel (median | p99 | foreground% | dyn.range | sat% | focus).
Buttons:
- Open Selected Image opens the image without saving the current one.
- Export CSV writes one row per image: image-level columns (including MaxFocus, MaxFocusZ, MaxIntensityZ, MaxIntensityChannel), then a block of columns for each channel (including LaplacianVariance).
- Close.
How to read it¶
- Sort by Score (the default) and check the top rows first.
- Background-heavy: mostly glass or empty. Exclude the image, re-acquire it, or crop it to the tissue.
- Saturated: a channel is clipped. Fix the exposure, or leave that channel out of intensity-based analyses.
- Weak signal: a flat, low-contrast image. Check the staining or exposure.
- Intensity outlier: a channel with signal is much brighter or dimmer than in the other images. The review pane names the channel. The classifier may find these images harder. Consider batch normalisation (§19) or extra labelling, and check the staining batch and acquisition settings.
- Focus (column and per channel): sort on it to find blurred images. It is not a verdict; low focus often means only that the image is dim.
- OK: pixel statistics are within the normal range for the project.
Caveats. With fewer than about 5 images, the z-scores are unreliable. Saturation is measured against the storage bit depth, so a 12-bit image stored as 16-bit is compared with 65535. Floating-point images show saturation as
n/a. Up to 4 images are read at once, each at about 2048 px on the long edge with all channels, so panels with many channels need more memory. This size cannot be changed in the dialog.