Intensity heatmaps¶
Menu: Extensions → SP Classify → Intensity Heatmaps...
Shows the mean whole-cell intensity of each marker for each cell class. Rows are classes and columns are markers (<marker>: Cell: Mean measurements). Use it to check that each class has high values for its expected markers, e.g. CD8 T cells high for CD8, Tregs high for FOXP3.
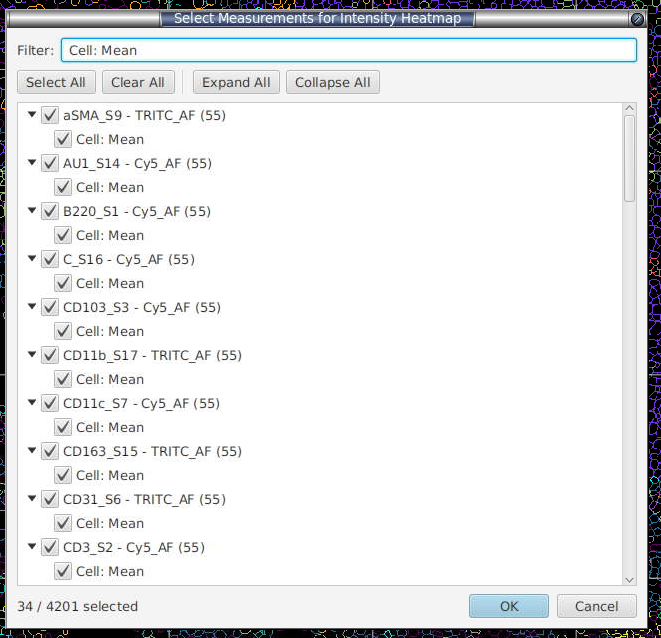
When the window opens, choose which whole-cell mean measurements to include:
Colour shows each marker's z-score across classes: red means the class is higher than other classes for that marker, blue means lower. Colours compare classes within one marker, not brightness between markers. Grey means no cells of that class had a value for that marker. Show mean values (ticked by default) prints the mean in each square.
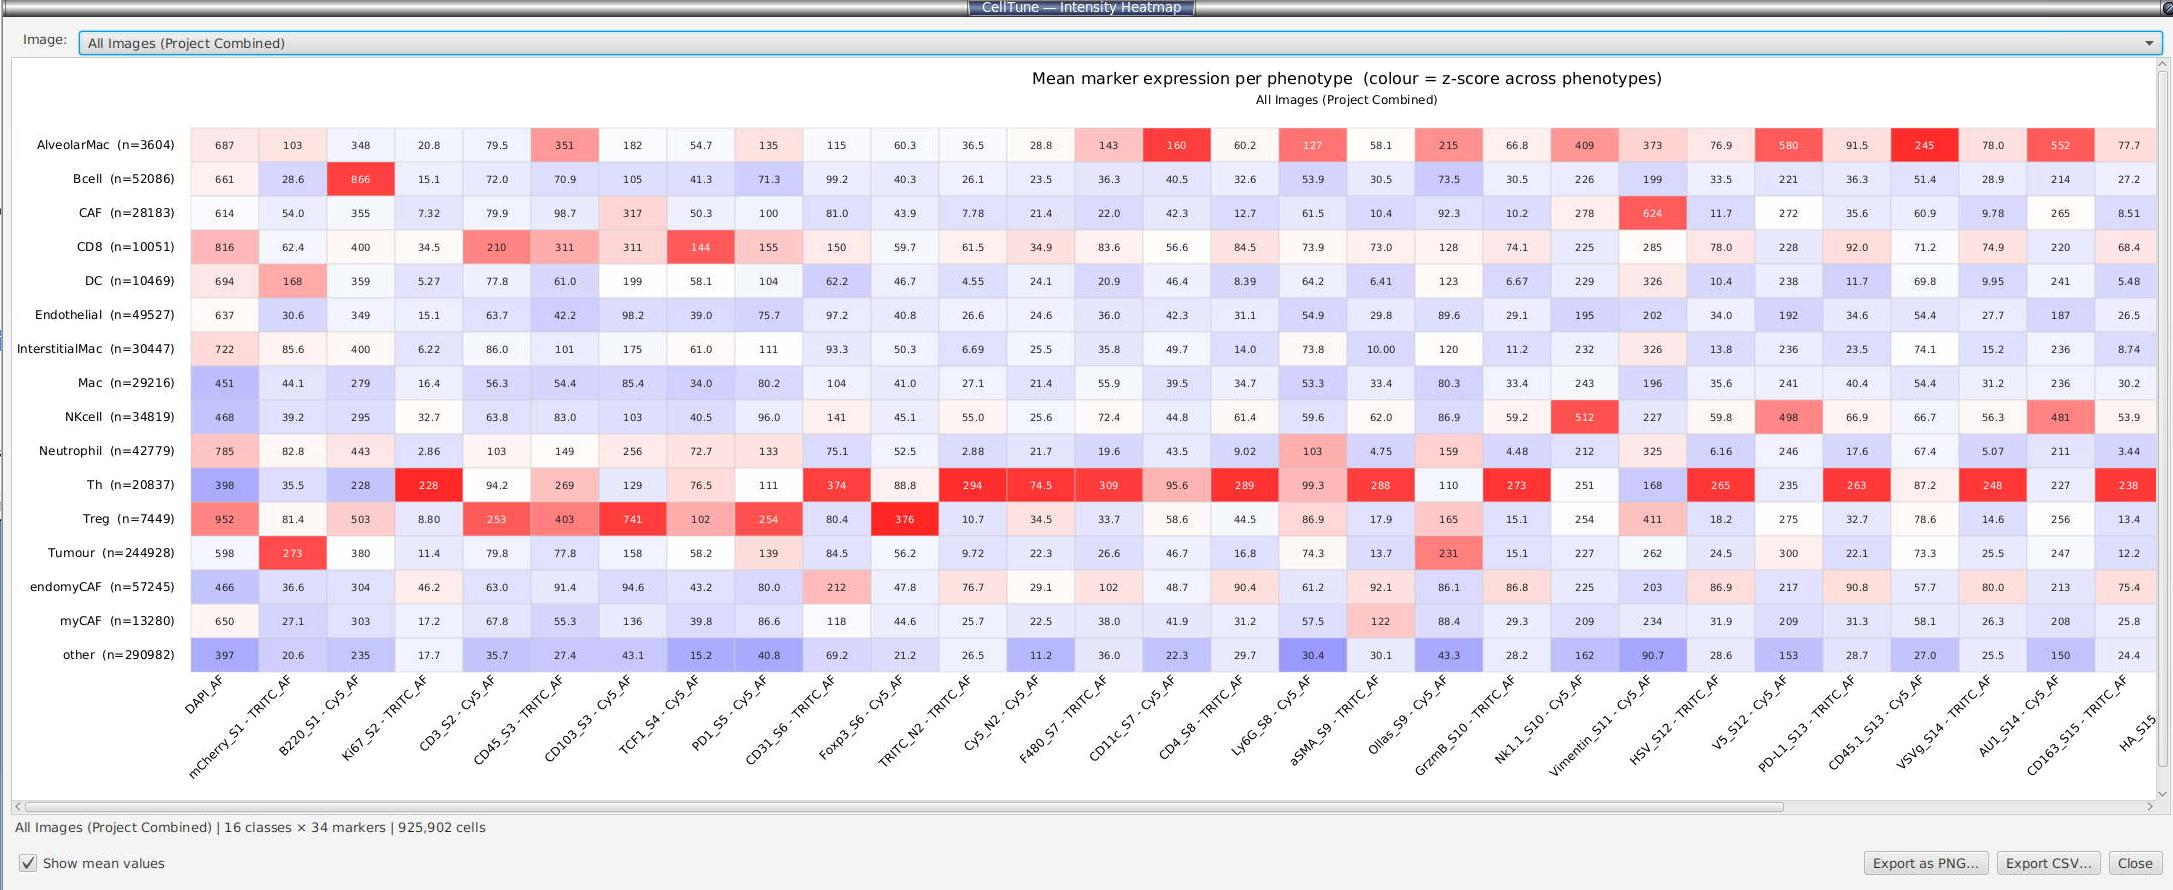
Image selector (top of the window): - The open image (selected by default). - Any other project image: its saved data is loaded and its heatmap calculated. While the window is open, the result is kept, so choosing the image again is immediate. - All Images (Project Combined): one heatmap for the whole project. Each mean is calculated over all cells from all images, not as an average of the per-image means.
Buttons:
- Export as PNG…: saves the heatmap as shown, on a white background.
- Export CSV…: saves a Class, CellCount, <marker>… table of the mean intensities (NA where a class had no value).
The heatmap needs
<marker>: Cell: Meanmeasurements. If your cells do not have them, run Analyze → Cell detection → Cell detection in QuPath first. Classes are taken from the current cell classifications, so run a classifier or gating (§11) before opening the heatmap.