Multi-class workflow in detail¶
5.1 Initial manual labelling¶
Click Manual Label Mode in the sidebar. A floating toolbar opens:
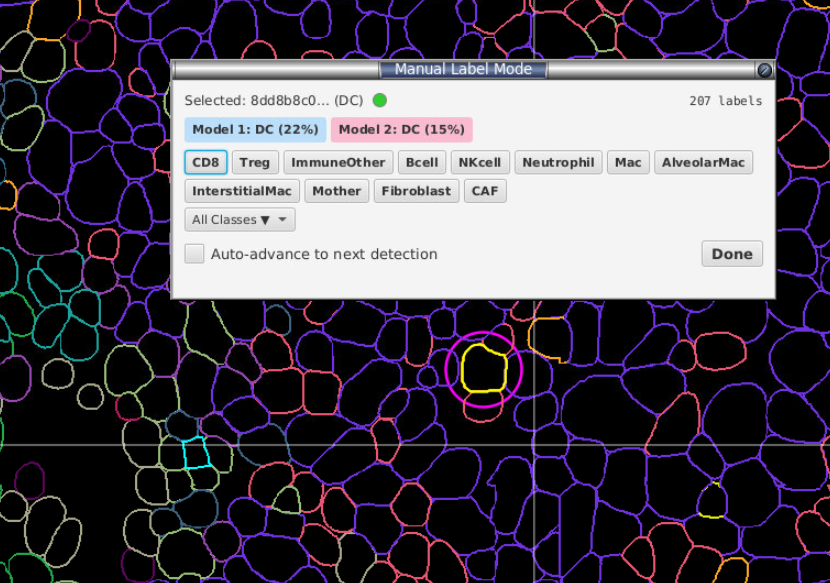
- Click a cell in the viewer. The toolbar shows its ID and current class. The status dot is lime if the cell has a class and white if it has none.
- The selected cell has a magenta ring.
- Up to 12 class buttons are shown in the toolbar. Other classes are under All Classes ▼.
- Auto-advance to next detection: when ticked, the next cell is selected after you assign a label.
- Cells that are already selected when the toolbar opens, or after you switch image, are used as the selection.
How many cells to label: label at least 20–30 cells per class before the first training run. Training does not start with fewer than 10 labelled cells in total. With Pool labels from all images ticked (always on in binary mode), labels on other images count towards the 10. Add more labels after each review cycle.
After the first training run, two more buttons appear: Model 1: CD8 (87%) (blue) and Model 2: CD4 (65%) (pink). Each shows that model's predicted class and confidence for the selected cell. Click one to accept that prediction.
5.2 Choose images to apply the classifier to¶
Click Apply to which images... in the sidebar.
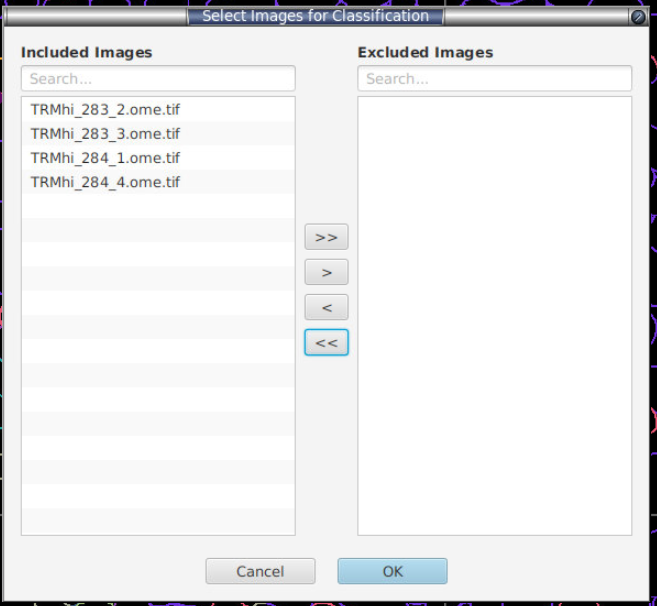
- The left list holds the images the classifier will be applied to. The right list holds excluded images.
- Use the search boxes and the arrow buttons (
>,>>,<,<<) to move images between the lists. - The open image is always included and cannot be moved.
- Click OK. The button then shows the number of images, e.g.
Apply to which images... (12).
Choose fewer images to make the apply step faster.
An image that lacks any measurement the classifier was trained on (for example a renamed channel, or cells measured with different settings) is not classified, and its saved labels are not used for training. A dialog after training lists these images and the missing measurements. The same check applies when the open image is classified for Review or Manual Label mode, and to each marker in composite classification.
5.3 CPU threads and Images at once¶

These two settings control speed. If their labels are cut off, widen the panel or hold the mouse over a control to see its tooltip.
CPU threads sets how many processor threads training uses. The default is 0, which uses all processors. Lower it to keep QuPath responsive during training, or when you share a compute node. The value is remembered between sessions. Changing it can change results very slightly, so use the same value when you compare two training runs.
Images at once sets how many images are classified at the same time after training. The default is 1 and the range is 1–8. It has no effect on training. Each image is loaded fully into memory, so a higher value uses more memory. Suggested values: 1 on a 16 GB machine, 2–3 on 32 GB. If QuPath runs out of memory, set it back to 1.
5.4 Pick the right settings¶
Most users can leave these at their defaults.
| Setting | Default | Turn on when… | Turn off when… |
|---|---|---|---|
| Pool labels from all images | ✅ | recommended (always on in binary mode) | you want a model trained on the open image's labels only |
Enable data balancing + SMOTE + Tomek |
✅ | one class has many fewer labels than others | classes are already balanced, or you want to train on the labels as they are |
| Auto-tune hyperparameters | ❌ | you can leave training running for several hours (see Auto-tune below) | you are still adding labels |
| Early stopping | ✅ | recommended | you need a fixed number of rounds, e.g. to reproduce a published setting |
| Train/val metrics | ✅ | you want the Training Metrics report | you are still adding labels (see below) |
| Show top 10 feature importance after training | ✅ | recommended | you do not want the chart to open after training |
| Auto-prune features (drop near-constant & redundant) | ✅ | recommended (faster training; no measurements are deleted) | you need every selected feature used, e.g. for a benchmark |
| Restrict to features shared with imported data | ❌ | you imported labels from a project with a different panel | you train on this project's labels only |
| Sample current image only | ❌ | you want to review cells from the open image only (§5.7) | you want to review cells from every image (default) |
Resampling strategies (the Strategy: dropdown, shown when Enable data balancing is ticked):
Leave this at the default (SMOTE + Tomek) unless you have a specific reason to change it.
| Strategy | Effect |
|---|---|
None |
No resampling |
SMOTE |
Adds synthetic cells to small classes, made from each cell's 5 nearest cells of the same class |
ADASYN |
Like SMOTE, but adds more synthetic cells where a small class is hard to separate from other classes |
Tomek links |
Finds pairs of cells of different classes that are each other's nearest neighbour, and removes the cell from the larger class |
SMOTE + Tomek (default) |
SMOTE, then Tomek links |
ADASYN + Tomek |
ADASYN, then Tomek links |
Use SMOTE alone if Tomek links removes too many labelled cells (the training log shows how many it removed). Use ADASYN if a small class is often confused with a larger one.
Train/val metrics produces the Training Metrics report (§5.6). It adds about a third to training time. It does not change the trained classifier unless Auto-tune is ticked: with metrics on, auto-tune uses only the training 80%, so the settings it chooses can differ. Untick it while you are still adding labels, and tick it again for your final run.
Auto-tune tests different model settings and keeps the best settings for each model. It trains 2 × Trials × CV folds models. The defaults are 20 trials and 5 folds, which is 200 models. Trials can be set from 5 to 100 and CV folds from 2 to 10; these controls are shown when Auto-tune hyperparameters is ticked. With many features and classes this can take several hours. The training log shows the number of models before it starts. With Train/val metrics ticked, auto-tune uses only the training 80%, so the 20% in the Training Metrics report is not used to choose settings. Its scoring macro F1 averages only the classes present in each fold.
Model 1 and Model 2. The default is XGBoost (Model 1) and LightGBM (Model 2). Random Forest is also available. Use two different model types: review mode depends on the two models disagreeing. Training refuses XGBoost + XGBoost and LightGBM + LightGBM, because the two slots would give identical predictions. Random Forest's confidence is the fraction of its trees that vote for the class. Training runs on the CPU only.
Rounds / Max depth. The defaults are 500 rounds (range 50–1000) and depth 6 (range 2–15).
- With Early stopping ticked (the default), Rounds is a maximum. Each model stops adding rounds when it stops improving on held-out cells from the training 80% (5-fold cross-validation below 2,000 labelled cells, a 10% inner split above). The 20% validation set used for Training Metrics is not used to choose rounds.
- With Early stopping unticked, every round is trained. Lower Rounds to reduce training time.
- Early stopping applies to XGBoost and LightGBM only, and needs at least 20 labelled cells; with fewer, every round is trained. Random Forest always uses 100 trees of depth 100 and ignores Rounds and Max depth.
The training log shows the rounds each model used, e.g. XGBoost early stopping: best round 127/500 (mean weighted val loss over 5 folds: 0.593412). If the number is close to the maximum, raise Rounds.
5.5 Train¶
Click Train. A progress window shows the current step. Before training starts:
- a backup of your labels is saved to
<project>/celltune/labels_backup_*.json. - SP Classify estimates how much memory training needs. If the estimate is more than 80% of the memory available to QuPath, a warning asks Proceed anyway? The estimate is approximate. To give QuPath more memory, set Edit → Preferences → Maximum memory and restart QuPath. To need less memory, select fewer features or set Strategy: to
None.
When training finishes, the sidebar status line shows e.g. Training complete — 523 cells classified, 47 disagreements.
The training log file¶
Each training run saves its log to <project>/celltune/logs/. The 20 most recent logs are kept. The file is kept after the progress window closes and after a crash. If no project is open, no log file is saved.
The log starts with the cell and label counts, every setting used and the available memory. It ends with the time taken by each step, slowest first:
── Where the time went ──────────────────────────────────
  fit XGBoost                326.61s   45.7%
  early stop: XGBoost        293.93s   41.1%
  early stop: folds            4.02s    0.6%
  apply to other images      118.40s    9.2%
  predict all cells           39.88s    5.6%
If training is slow, this table shows which step took longest. If a run fails, the last line names the step that failed.
If training fails before any model is retrained (for example, too few classes), the previous classifier stays loaded. If it fails after a model was partly retrained, no classifier is loaded until you train again or reopen the project.
5.6 Inspecting the result¶
Three buttons become available after training: Agreement Confusion Matrix, Training Metrics and Feature Importance....
Confusion Matrix (button)¶
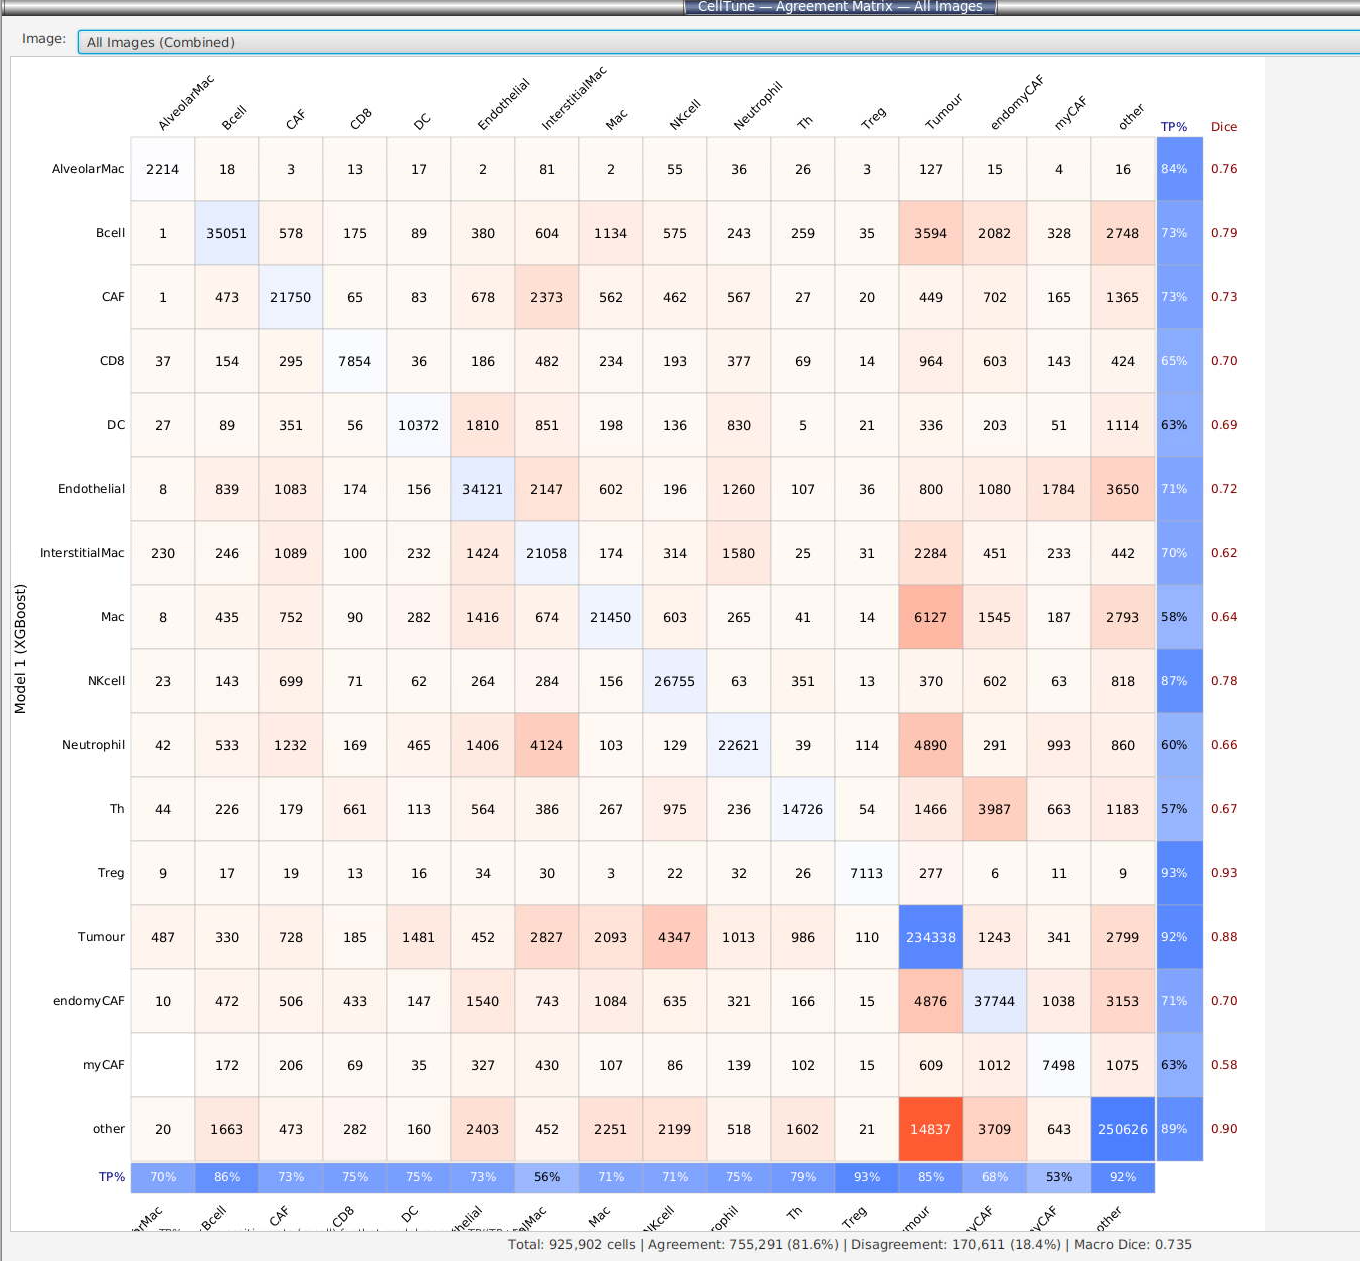
Agreement Confusion Matrix compares the two models' predictions for every cell. Rows are Model 1's predictions and columns are Model 2's. The axis titles name the model types you chose, e.g. Model 1 (XGBoost) and Model 2 (LightGBM).
- Diagonal (blue): cells where both models chose the same class.
- Off the diagonal (orange/red): cells where the models chose different classes. Review mode samples from these cells.
- Right column: for each Model 1 class, the percentage of its cells that Model 2 also assigned to that class.
- Bottom row: for each Model 2 class, the percentage of its cells that Model 1 also assigned to that class.
- Dice column: agreement score per class, from 0 (no agreement) to 1 (full agreement).
- Summary line:
Total: X cells | Agreement: Y (Z%) | Disagreement: A (B%) | Macro Dice: D. Macro Dice is the mean Dice over all classes.
If most cells are on the diagonal, the two models mostly agree. A large value off the diagonal shows two classes the models often confuse (e.g. CD4 and CD8). Label more cells of those two classes in the next round.
The Image: selector at the top switches to another image's saved predictions or to All Images (Combined). Images whose saved predictions were made with a different class list are left out of the combined matrix, and the window title gives the number skipped. Choosing one of those images on its own shows a warning instead.
Training Metrics (button)¶
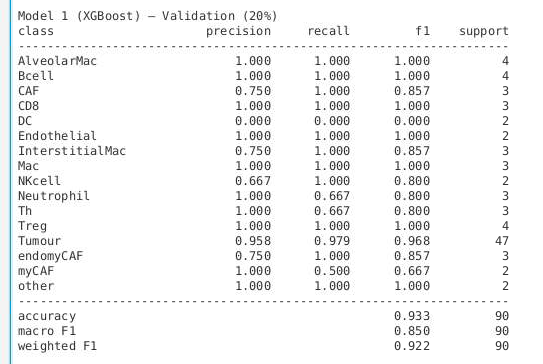
Training Metrics shows precision, recall, F1 and support (number of cells) for each class and each model. These are calculated on 20% of the labelled cells of each class, held back from training:
class            precision   recall      f1   support
─────────────────────────────────────────────────────
CD4                  0.925    0.887    0.906       145
CD8                  0.891    0.923    0.907       198
…
─────────────────────────────────────────────────────
accuracy                              0.905       500
macro F1                              0.894       500
weighted F1                           0.903       500
Tick Show 80% training-set rows (for over-fit diagnosis) to also show the scores on the training cells.
The line above the tables gives the number of labelled cells in the 80% and 20% sets. When balancing is on, it also gives the number of rows in the 80% set after balancing; the training-set scores are computed on those rows, including the synthetic ones. The 20% set is never balanced.
- Macro F1 is the mean F1 over the classes that have cells in the set or are predicted in it. A class with neither is shown as
not in this setand left out of the mean. - How the round count was chosen is shown above the tables. With early stopping on it was chosen on cells from the 80% only, so the 20% has not influenced the model. Metrics saved by an earlier version say so: those versions chose rounds on the 20%, so their scores can be slightly optimistic.
- New images: the 20% is drawn from the same images as the 80%, often from neighbouring cells. Expect lower scores on images with no labels.
- Small classes: with SMOTE or ADASYN, classes with fewer than 6 labelled cells get a warning before training. Their synthetic cells are near-copies of the few labelled ones, and their validation scores rest on 1 or 2 cells.
Validation Confusion Matrix (XGBoost)… (the name in brackets is Model 1's type) shows the true class (rows) against Model 1's predicted class (columns) for the same 20% of cells. It has two heatmaps: cell counts, and counts as a percentage of each row. The diagonal of the percentage heatmap is each class's recall.
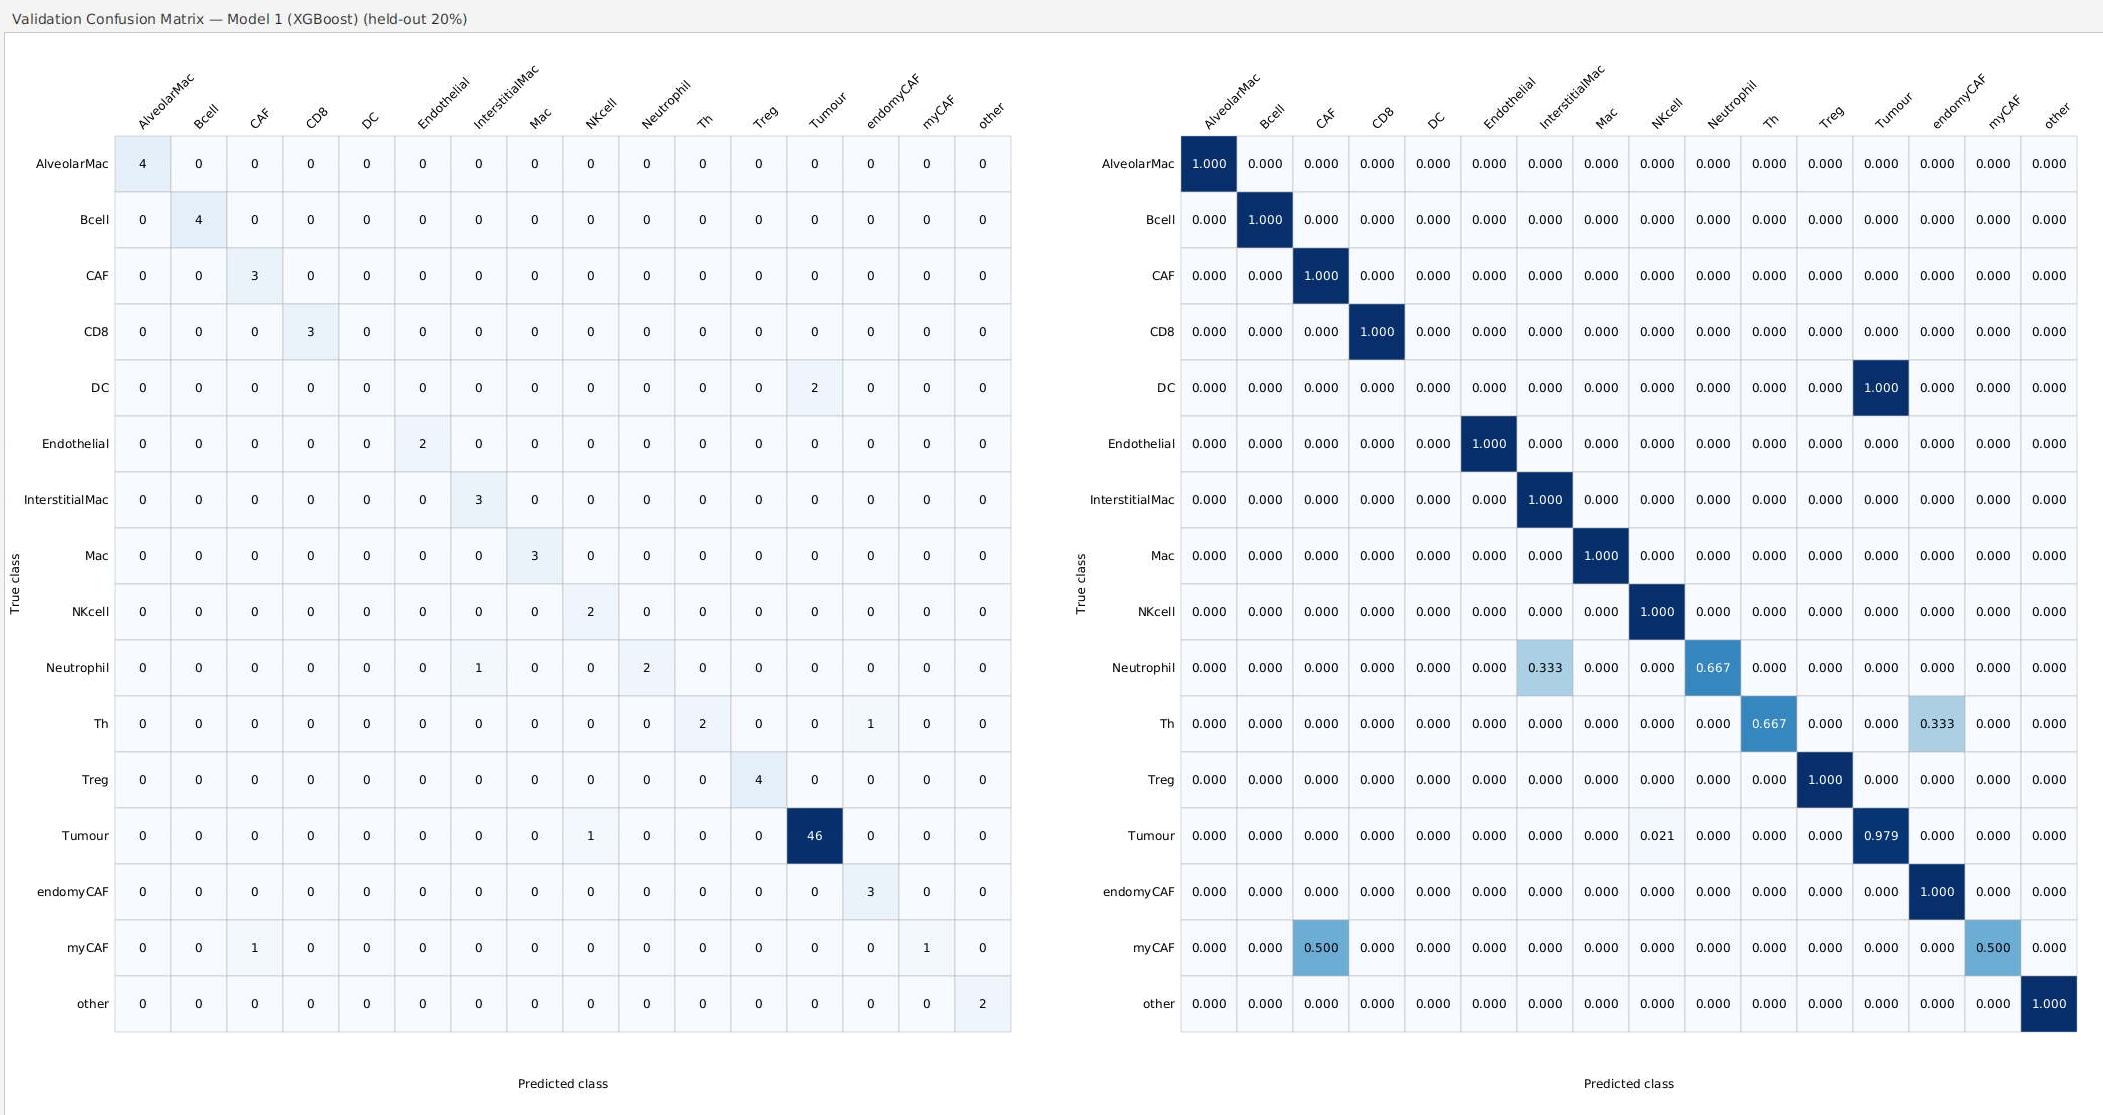
Exports:
- Download CSV… (Training Metrics window): long format split,model,class,precision,recall,f1,support. Summary rows have the class __accuracy__, __macro_f1__ or __weighted_f1__, so you can filter them out in pandas or R. A class that is not in the set has support 0 and is not included in __macro_f1__.
- Download PNG… (Validation Confusion Matrix window): both heatmaps side by side. This window also has Download CSV….
A high F1 score does not mean the classifier works on new images. The validation cells come from the same images as the training cells, so F1 overestimates performance on other images. To check, open a different image, apply the classifier, look at the results, and check the Project Prediction Summary (§8). If predictions on an image look wrong, label some of its cells and retrain.
Feature Importance (button)¶
Feature Importance... shows the 10 features that most affect each class's prediction (mean |SHAP| value), as horizontal bars. Use the Class: dropdown to switch class. Values come from the XGBoost model and from any Random Forest model (for Random Forest, split importance: mean decrease in impurity). With batch correction on, the open image's gains are applied. LightGBM is not included, so with the default pair (XGBoost + LightGBM) the chart shows XGBoost only.
Use it to find features to remove:
- If one feature (e.g.
Cell: DAPI Mean) ranks highest for every class, de-select it in Select Features (§4.1) and retrain. - If a non-biological column, such as a cell ID or a centroid coordinate, ranks near the top, it was included in training by mistake. De-select it in Select Features and retrain.
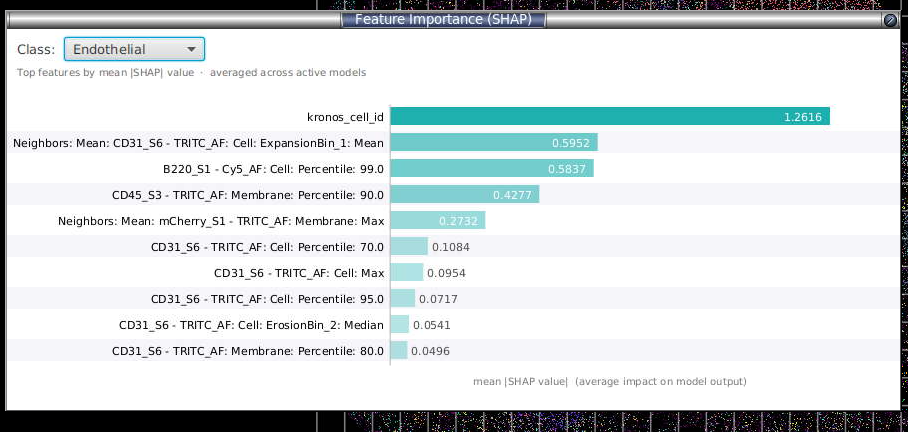
In this example kronos_cell_id (a cell index) ranks highest. De-select it in Select Features.
5.7 Optional — restrict sampling to specific annotations¶
Two controls above Enter Review Mode limit which cells review mode samples:
- Sample current image only (checkbox): sample from the open image only.
- Specify annotations (text field): enter words separated by commas, e.g.
Tumour, Margin. Only cells whose centre is inside an annotation whose name contains one of the words are sampled. Case is ignored.
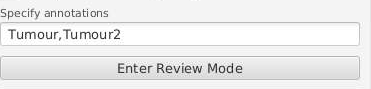
Leave the box unticked and the field empty to sample from every cell in every project image (the default).